Graphing in Python using Matplotlib and Pandas

Weather analysis

In this tutorial we use the Python Pandas and Matplotlib packages to analyse and visualise weather data. Time series graphs, scatter plots, histograms and box-and-whisker plots are created using matplotlib functions. Pandas functions are used to read the data file, display summary information and rename columns.

The data source used in this tutorial is from the Australian Bureau of Meteorology. We focus on the minimum and maximum daily temperatures for Adelaide, Australia, in the first three months of 2022 using data downloaded from the .

Note that the code from this tutorial is taken from a Jupyter notebook where commands are processed in cells and the results displayed. However this code can be easily adapted to run from a Python IDE such as IDLE or Pycharm. The main change required is to add a print statement to display table results, and a plt.show() command to display graphs.

Lightning cloud to cloud (aka)

Importing packages

This tutorial uses the Pandas package to read the data from the source file into a dataframe. Graphical representations of the data, including histograms, box plots and time series graphs are created using functions from the Matplotlib package.

import pandas as pd
import matplotlib.pyplot as plt

Reading the data

We begin by reading the weather data for January 2022. The following options are used:

  • the dayfirst option lets the reader know that the dates are given in Australian/European format where the days are given first (by default the reader uses the US format where the month is written first).
  • the parse_dates option indicates which columns should be converted into dates.
df1=pd.read_csv("data/IDCJDW5081.202201.csv", dayfirst=True, parse_dates=['Date'])

Next we print out the first five rows of the data, restricting the view to the first three columns, which contain the date, minimum temperature and maximum temperature.

df1[0:5][df1.columns[0:3]]
Date Minimum temperature (°C) Maximum temperature (°C)
0 2022-01-01 22.5 33.6
1 2022-01-02 19.3 30.6
2 2022-01-03 14.1 25.9
3 2022-01-04 14.2 24.4
4 2022-01-05 14.4 21.5

Renaming columns

To make it easier to refer to the minimum and maximum temperature columns we rename the label for these two columns. Calling the info function then prints a summary of the data stored in the dataframe. Notice that the minimum and maximum value columns have been renamed.

df1.rename(columns={df1.columns[1]: "Minimum", df1.columns[2] : "Maximum"}, inplace=True)
df1.info()
<class 'pandas.core.frame.DataFrame'>
RangeIndex: 31 entries, 0 to 30
Data columns (total 21 columns):
 #   Column                             Non-Null Count  Dtype         
---  ------                             --------------  -----         
 0   Date                               31 non-null     datetime64[ns]
 1   Minimum                            31 non-null     float64       
 2   Maximum                            31 non-null     float64       
 3   Rainfall (mm)                      31 non-null     float64       
 4   Evaporation (mm)                   0 non-null      float64       
 5   Sunshine (hours)                   0 non-null      float64       
 6   Direction of maximum wind gust     31 non-null     object        
 7   Speed of maximum wind gust (km/h)  31 non-null     int64         
 8   Time of maximum wind gust          31 non-null     object        
 9   9am Temperature (°C)               31 non-null     float64       
 10  9am relative humidity (%)          31 non-null     int64         
 11  9am cloud amount (oktas)           0 non-null      float64       
 12  9am wind direction                 31 non-null     object        
 13  9am wind speed (km/h)              31 non-null     object        
 14  9am MSL pressure (hPa)             31 non-null     float64       
 15  3pm Temperature (°C)               31 non-null     float64       
 16  3pm relative humidity (%)          31 non-null     int64         
 17  3pm cloud amount (oktas)           0 non-null      float64       
 18  3pm wind direction                 31 non-null     object        
 19  3pm wind speed (km/h)              31 non-null     int64         
 20  3pm MSL pressure (hPa)             31 non-null     float64       
dtypes: datetime64[ns](1), float64(11), int64(4), object(5)
memory usage: 5.2+ KB

Time series graphs

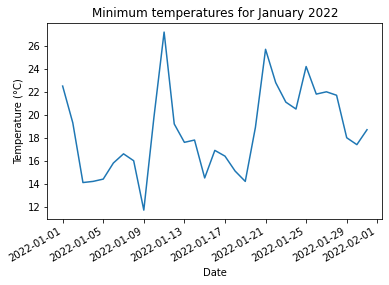
The first graphs that we create are time series graphs, which will display the change in minimum/maximum temperatures over time. This is created using the plot_date function. This function takes two lines of the values – the first list corresponds to the dates in the Date column, the second list corresponds to the minimum temperatures column.

The autofmt_xdate function ensures that the dates are displayed in an appropriate manner.

fig,ax=plt.subplots()
ax.set_title("Minimum temperatures for January 2022")
ax.set_xlabel("Date")
ax.set_ylabel("Temperature (°C)")
fig.autofmt_xdate()
ax.plot_date(df1[["Date"]], df1[["Minimum"]], linestyle="solid", markersize=0)
[<matplotlib.lines.Line2D at 0x1da7f8a6a30>]

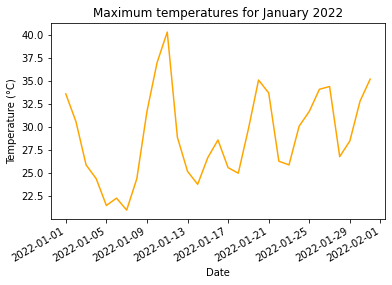
The same process is used to display the maximum temperatures over time.

fig,ax=plt.subplots()
ax.set_title("Maximum temperatures for January 2022")
ax.set_xlabel("Date")
ax.set_ylabel("Temperature (°C)")
fig.autofmt_xdate()
ax.plot_date(df1[["Date"]], df1[["Maximum"]], linestyle="solid", markersize=0, color="orange")
[<matplotlib.lines.Line2D at 0x1da7db9be50>]

Scatter plots

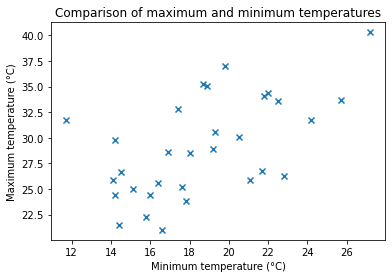
Scatter plots can be used to compare two sets of data values. In this case create a scatter plot to compare the daily minimum and maximum temperatures.

fig,ax=plt.subplots()
ax.set_title("Comparison of maximum and minimum temperatures")
ax.set_xlabel("Minimum temperature (°C)")
ax.set_ylabel("Maximum temperature (°C)")
ax.scatter(df1[["Minimum"]], df1[["Maximum"]], marker="x")
<matplotlib.collections.PathCollection at 0x1da7dc8c160>

Combining data

Data can be read from multiple data sources and then combined into a single dataframe. For this example we combine the weather data from January 2022 with data from February 2022 and March 2022.

df2=pd.read_csv("data/IDCJDW5081.202202.csv", dayfirst=True, parse_dates=['Date'])
df3=pd.read_csv("data/IDCJDW5081.202203.csv", dayfirst=True, parse_dates=['Date'])
df2.rename(columns={df2.columns[1]: "Minimum", df2.columns[2] : "Maximum"}, inplace=True)
df3.rename(columns={df3.columns[1]: "Minimum", df3.columns[2] : "Maximum"}, inplace=True)
df=pd.concat([df1, df2, df3])
df[df.columns[0:3]]
Date Minimum Maximum
0 2022-01-01 22.5 33.6
1 2022-01-02 19.3 30.6
2 2022-01-03 14.1 25.9
3 2022-01-04 14.2 24.4
4 2022-01-05 14.4 21.5
26 2022-03-27 16.9 31.8
27 2022-03-28 16.4 27.4
28 2022-03-29 12.5 24.0
29 2022-03-30 13.6 22.9
30 2022-03-31 14.6 21.0

90 rows × 3 columns

df[["Minimum","Maximum"]].describe()
Minimum Maximum
count 90.000000 90.000000
mean 17.063333 28.116667
std 3.524344 4.399240
min 11.500000 21.000000
25% 14.625000 24.400000
50% 16.600000 27.550000
75% 19.150000 31.775000
max 27.200000 40.300000

Histograms

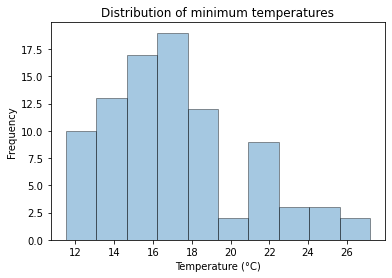
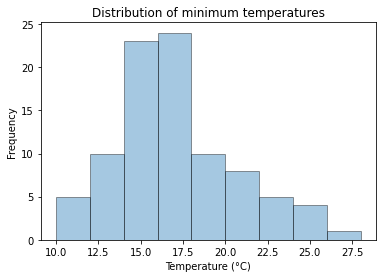
Histograms are used to show the distribution of continuous data. In this section we create histograms to display the distribution of minimum and maximum temperatures.

We begin by creating a histogram to display the minimum temperatures.

plt.hist(df[["Minimum"]], edgecolor="k", alpha=0.4)
plt.xlabel("Temperature (°C)")
plt.ylabel("Frequency")
plt.title("Distribution of minimum temperatures")
Text(0.5, 1.0, 'Distribution of minimum temperatures')

Whilst this graph shows the distribution of temperatures quite clearly, the automatic selection of bins (the lower and upper limits of each of the columns in the histogram) is not ideal. In particular it is difficult to see what the exact limits of the bins are. We can improve this by setting these values.

In the code below we set the bins for the minimum and maximum temperature histograms. This is done using a list comprehension.

minbins=[2*x for x in range(5, 15)]
maxbins=[2*x for x in range(10, 21)]
minbins
[10, 12, 14, 16, 18, 20, 22, 24, 26, 28]
plt.hist(df[["Minimum"]],bins=minbins, edgecolor="k", alpha=0.4)
plt.xlabel("Temperature (°C)")
plt.ylabel("Frequency")
plt.title("Distribution of minimum temperatures")
Text(0.5, 1.0, 'Distribution of minimum temperatures')

Combining graphs

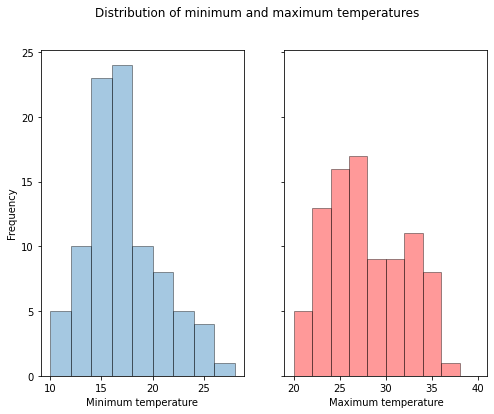
Multiple graphs can be displayed using subplots.

In the example below we display histograms for minimum and maximum temperatures, showing the graphs side by side.

  • The first argument of the subplots function defines the number of rows of graphs.
  • The second argument of the subplots function defines the number of columns of graphs.
  • The figsize option defines the size of the resulting figure containing the graphs. In this case the resultant figure will be 8 inches across, by 6 inches high.
  • The sharey option indicates that the two graphs will share
    the scale for y-axis.

The suptitle command sets a title for all graphs within the subplots.

fig, (ax1,ax2) = plt.subplots(1,2, figsize=(8,6), sharey=True)
ax1.hist(df[["Minimum"]], bins=minbins, edgecolor='k', alpha=0.4)
ax1.set_xlabel("Minimum temperature")
ax2.hist(df[["Maximum"]], bins=maxbins, edgecolor='k', alpha=0.4, color="red")
ax2.set_xlabel("Maximum temperature")
ax1.set_ylabel("Frequency")
plt.suptitle("Distribution of minimum and maximum temperatures")
Text(0.5, 0.98, 'Distribution of minimum and maximum temperatures')

Box and whisker plots

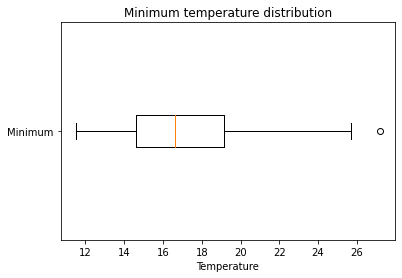
Box and whisker plots are created using the boxplot function. In the following example we create box plot showing the distribution for minimum temperatures. The following options are used:

  • vert determines whether or not to display the box plots vertically. In this case we set the option to false, meaning the boxplots will be displayed horizontally.
  • labels takes a list of strings. These strings are used for the boxplot labels.

Outliers are displayed as a circle beyond the whiskers. In this case there is one outlier corresponding to the minimum temperature of 27.2°C.

fig, ax= plt.subplots()
ax.boxplot(df["Minimum"], vert=False, labels=["Minimum"])
ax.set_title("Minimum temperature distribution")
ax.set_xlabel("Temperature")
Text(0.5, 0, 'Temperature')

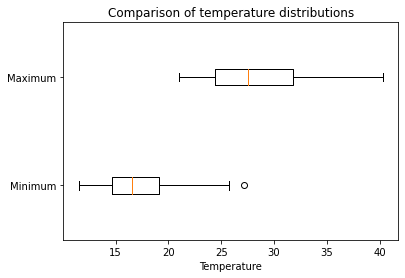
Parallel boxplots

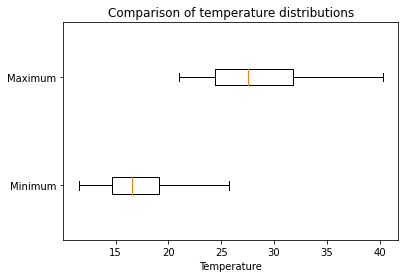
Parallel boxplots are created by passing multiple lists of values to the first input of the boxplot function.

fig, ax= plt.subplots()
ax.boxplot(df[["Minimum", "Maximum"]], vert=False, labels=["Minimum", "Maximum"])
ax.set_title("Comparison of temperature distributions")
ax.set_xlabel("Temperature")
Text(0.5, 0, 'Temperature')

Hiding outliers

Outliers can be hidden in boxplots by setting the showfliers option to false.

fig, ax= plt.subplots()
ax.boxplot(df[["Minimum", "Maximum"]], vert=False, labels=["Minimum", "Maximum"], showfliers=False)
ax.set_title("Comparison of temperature distributions")
ax.set_xlabel("Temperature")
Text(0.5, 0, 'Temperature')

Pandas Tutorial: Grouping data

In this tutorial we look at how data can be grouped (for example by year) and how the resulting grouped data can be viewed and analysed.


The data source for this tutorial is the Top 1000 Movies by IMDB Rating.
The data will be grouped by year, genre and actor in this tutorial to provide a variety of insights into the data.

Reading the data

import pandas as pd

We begin by reading data from IMDB into the movies_df dataframe. We then show the first 5 rows in this dataframe.

movies_df = pd.read_csv("data/IMDB-Movie-Data.csv", index_col="Rank")
movies_df.head(5)
Title Genre Description Director Actors Year Runtime (Minutes) Rating Votes Revenue (Millions) Metascore
Rank
1 Guardians of the Galaxy Action,Adventure,Sci-Fi A group of intergalactic criminals are forced … James Gunn Chris Pratt, Vin Diesel, Bradley Cooper, Zoe S… 2014 121 8.1 757074 333.13 76.0
2 Prometheus Adventure,Mystery,Sci-Fi Following clues to the origin of mankind, a te… Ridley Scott Noomi Rapace, Logan Marshall-Green, Michael Fa… 2012 124 7.0 485820 126.46 65.0
3 Split Horror,Thriller Three girls are kidnapped by a man with a diag… M. Night Shyamalan James McAvoy, Anya Taylor-Joy, Haley Lu Richar… 2016 117 7.3 157606 138.12 62.0
4 Sing Animation,Comedy,Family In a city of humanoid animals, a hustling thea… Christophe Lourdelet Matthew McConaughey,Reese Witherspoon, Seth Ma… 2016 108 7.2 60545 270.32 59.0
5 Suicide Squad Action,Adventure,Fantasy A secret government agency recruits some of th… David Ayer Will Smith, Jared Leto, Margot Robbie, Viola D… 2016 123 6.2 393727 325.02 40.0

Next, for convenience, we rename all of the column titles so that they are all lowercase.

movies_df.columns = [col.lower() for col in movies_df]

Grouping by year

The data is grouped by year. This creates a grouped dataframe – this is essentially a collection of dataframes that are index by the year.

grouped=movies_df.groupby(["year"])

Inspecting a particular year

If wanted to view the information for a particular group (in this case for a particular year) we can use the get_group function. The code below will get the dataframe for 2009 and show the first 5 entries.

grouped.get_group(2009).head(5)
title genre description director actors year runtime (minutes) rating votes revenue (millions) metascore
Rank
78 Inglourious Basterds Adventure,Drama,War In Nazi-occupied France during World War II, a… Quentin Tarantino Brad Pitt, Diane Kruger, Eli Roth,Mélanie Laurent 2009 153 8.3 959065 120.52 69.0
88 Avatar Action,Adventure,Fantasy A paraplegic marine dispatched to the moon Pan… James Cameron Sam Worthington, Zoe Saldana, Sigourney Weaver… 2009 162 7.8 935408 760.51 83.0
141 Star Trek Action,Adventure,Sci-Fi The brash James T. Kirk tries to live up to hi… J.J. Abrams Chris Pine, Zachary Quinto, Simon Pegg, Leonar… 2009 127 8.0 526324 257.70 82.0
148 Watchmen Action,Drama,Mystery In 1985 where former superheroes exist, the mu… Zack Snyder Jackie Earle Haley, Patrick Wilson, Carla Gugi… 2009 162 7.6 410249 107.50 56.0
252 Kynodontas Drama,Thriller Three teenagers live isolated, without leaving… Yorgos Lanthimos Christos Stergioglou, Michele Valley, Angeliki… 2009 94 7.3 50946 0.11 73.0

Sorting values

In the following code we use the sort_values function to sort the movies released in 2009 into from best to worst (using ascending=False) and from worst to best (using ascending=True or omitting this option).

The first three entries from each of these sorted dataframes are displayed.

grouped.get_group(2009).sort_values(by="rating", ascending=False).head(3)
title genre description director actors year runtime (minutes) rating votes revenue (millions) metascore
Rank
431 3 Idiots Comedy,Drama Two friends are searching for their long lost … Rajkumar Hirani Aamir Khan, Madhavan, Mona Singh, Sharman Joshi 2009 170 8.4 238789 6.52 67.0
78 Inglourious Basterds Adventure,Drama,War In Nazi-occupied France during World War II, a… Quentin Tarantino Brad Pitt, Diane Kruger, Eli Roth,Mélanie Laurent 2009 153 8.3 959065 120.52 69.0
500 Up Animation,Adventure,Comedy Seventy-eight year old Carl Fredricksen travel… Pete Docter Edward Asner, Jordan Nagai, John Ratzenberger,… 2009 96 8.3 722203 292.98 88.0
grouped.get_group(2009).sort_values(by="rating").head(3)
title genre description director actors year runtime (minutes) rating votes revenue (millions) metascore
Rank
872 Dragonball Evolution Action,Adventure,Fantasy The young warrior Son Goku sets out on a quest… James Wong Justin Chatwin, James Marsters, Yun-Fat Chow, … 2009 85 2.7 59512 9.35 45.0
937 The Human Centipede (First Sequence) Horror A mad scientist kidnaps and mutilates a trio o… Tom Six Dieter Laser, Ashley C. Williams, Ashlynn Yenn… 2009 92 4.4 60655 0.18 33.0
349 Jennifer’s Body Comedy,Horror A newly possessed high school cheerleader turn… Karyn Kusama Megan Fox, Amanda Seyfried, Adam Brody, Johnny… 2009 102 5.1 96617 16.20 47.0
grouped.get_group(2009).sort_values(by="metascore", ascending=False).head(3)
title genre description director actors year runtime (minutes) rating votes revenue (millions) metascore
Rank
500 Up Animation,Adventure,Comedy Seventy-eight year old Carl Fredricksen travel… Pete Docter Edward Asner, Jordan Nagai, John Ratzenberger,… 2009 96 8.3 722203 292.98 88.0
815 Fantastic Mr. Fox Animation,Adventure,Comedy An urbane fox cannot resist returning to his f… Wes Anderson George Clooney, Meryl Streep, Bill Murray, Jas… 2009 87 7.8 149779 21.00 83.0
88 Avatar Action,Adventure,Fantasy A paraplegic marine dispatched to the moon Pan… James Cameron Sam Worthington, Zoe Saldana, Sigourney Weaver… 2009 162 7.8 935408 760.51 83.0
grouped.get_group(2009).sort_values(by="metascore", ascending=True).head(3)
title genre description director actors year runtime (minutes) rating votes revenue (millions) metascore
Rank
398 Couples Retreat Comedy A comedy centered around four couples who sett… Peter Billingsley Vince Vaughn, Malin Akerman, Jon Favreau, Jaso… 2009 113 5.5 86417 109.18 23.0
900 Bride Wars Comedy,Romance Two best friends become rivals when they sched… Gary Winick Kate Hudson, Anne Hathaway, Candice Bergen, Br… 2009 89 5.5 83976 58.72 24.0
453 Pandorum Action,Horror,Mystery A pair of crew members aboard a spaceship wake… Christian Alvart Dennis Quaid, Ben Foster, Cam Gigandet, Antje … 2009 108 6.8 126656 10.33 28.0

Summary information

Summary calculations can be done on the grouped data. For example we can calculate the mean rating for each year using the mean function.

grouped[["rating"]].mean()
rating
year
2006 7.125000
2007 7.133962
2008 6.784615
2009 6.960784
2010 6.826667
2011 6.838095
2012 6.925000
2013 6.812088
2014 6.837755
2015 6.602362
2016 6.436700

Similarly, the maximum metascore value for each year can be calculated using the max function. Whilst this tables shows us what the top metascore was for each year, it does not show the associated movie title (or any other associated information). Other aggregate functions also have a similar limitation. We will show in the next section how to create a more detailed summary of the best (or worst) movies.

grouped[["metascore"]].max()
metascore
year
2006 98.0
2007 96.0
2008 94.0
2009 88.0
2010 95.0
2011 94.0
2012 95.0
2013 96.0
2014 100.0
2015 95.0
2016 99.0

Top rated movie for each year

In the following code we create a new dataframe showing the top rated movie from each year from 2006 up until 2016. For each entry we show the year of release, movie title, rating and (for comparison) the metascore.

To create this dataframe we begin by creating a new dictionary and add entries for the four columns of interest noted above. Then for each group in the grouped data frame we get the row with the highest rating. This is done by sorting the group on the rating in descending order, then getting the first row in the sorted group.

data = {}
data["year"]=[]
data["title"]=[]
data["rating"]=[]
data["metascore"]=[]
for year, group in grouped:
    best=group.sort_values(by="rating", ascending=False).iloc[0]
    data["year"].append(best['year'])
    data["title"].append(best['title'])
    data["rating"].append(best['rating'])
    data["metascore"].append(best['metascore'])
best_df=pd.DataFrame(data)
best_df
year title rating metascore
0 2006 The Prestige 8.5 66.0
1 2007 Taare Zameen Par 8.5 42.0
2 2008 The Dark Knight 9.0 82.0
3 2009 3 Idiots 8.4 67.0
4 2010 Inception 8.8 74.0
5 2011 The Intouchables 8.6 57.0
6 2012 The Dark Knight Rises 8.5 78.0
7 2013 The Wolf of Wall Street 8.2 75.0
8 2014 Interstellar 8.6 74.0
9 2015 Bahubali: The Beginning 8.3 NaN
10 2016 Dangal 8.8 NaN

Best movies by metascore

For comparison we also create a dataframe to store the top movie (ranked by metascore) for each year.

data = {}
data["year"]=[]
data["title"]=[]
data["rating"]=[]
data["metascore"]=[]
for year, group in grouped:
    best=group.sort_values(by="metascore", ascending=False).iloc[0]
    data["year"].append(best['year'])
    data["title"].append(best['title'])
    data["rating"].append(best['rating'])
    data["metascore"].append(best['metascore'])
best_df=pd.DataFrame(data)
best_df
year title rating metascore
0 2006 Pan’s Labyrinth 8.2 98.0
1 2007 Ratatouille 8.0 96.0
2 2008 The Hurt Locker 7.6 94.0
3 2009 Up 8.3 88.0
4 2010 The Social Network 7.7 95.0
5 2011 Megan Is Missing 4.9 94.0
6 2012 Zero Dark Thirty 7.4 95.0
7 2013 Gravity 7.8 96.0
8 2014 Boyhood 7.9 100.0
9 2015 Carol 7.2 95.0
10 2016 Moonlight 7.5 99.0

Summarising the distributions of ratings using a boxplot

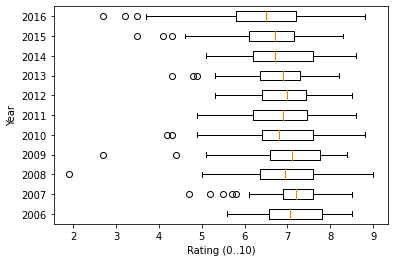
In the following code we show how boxplots can be created for each year of release and shown on the same graph for easy comparison of movie ratings across each year.

import matplotlib.pyplot as plt
data = []
years = []
for year, group in grouped:
    data.append(group["rating"])
    years.append(year)
plt.boxplot(data, labels=years, vert=False)
plt.xlabel("Rating (0..10)")
plt.ylabel("Year")
Text(0, 0.5, 'Year')

Grouping by genre

Next we group the movies by genre. However we note that in the original datafile many of the movies had multiple comma separated genres. The following code creates a new data frame with movies that had multiple genres split across multiple rows with one genre list per row.

data={}
for c in movies_df.columns:
    data=[]
for i in range(0, movies_df.shape[0]):
    genre_list=movies_df.iloc[i]['genre'].split(',')
    
    for g in genre_list:
        data["genre"].append(g)
        for c in movies_df.columns:
            if c != "genre":
                data.append(movies_df.iloc[i])
movies_genre_df = pd.DataFrame(data)
movies_genre_df
title genre description director actors year runtime (minutes) rating votes revenue (millions) metascore
0 Guardians of the Galaxy Action A group of intergalactic criminals are forced … James Gunn Chris Pratt, Vin Diesel, Bradley Cooper, Zoe S… 2014 121 8.1 757074 333.13 76.0
1 Guardians of the Galaxy Adventure A group of intergalactic criminals are forced … James Gunn Chris Pratt, Vin Diesel, Bradley Cooper, Zoe S… 2014 121 8.1 757074 333.13 76.0
2 Guardians of the Galaxy Sci-Fi A group of intergalactic criminals are forced … James Gunn Chris Pratt, Vin Diesel, Bradley Cooper, Zoe S… 2014 121 8.1 757074 333.13 76.0
3 Prometheus Adventure Following clues to the origin of mankind, a te… Ridley Scott Noomi Rapace, Logan Marshall-Green, Michael Fa… 2012 124 7.0 485820 126.46 65.0
4 Prometheus Mystery Following clues to the origin of mankind, a te… Ridley Scott Noomi Rapace, Logan Marshall-Green, Michael Fa… 2012 124 7.0 485820 126.46 65.0
2550 Search Party Adventure A pair of friends embark on a mission to reuni… Scot Armstrong Adam Pally, T.J. Miller, Thomas Middleditch,Sh… 2014 93 5.6 4881 NaN 22.0
2551 Search Party Comedy A pair of friends embark on a mission to reuni… Scot Armstrong Adam Pally, T.J. Miller, Thomas Middleditch,Sh… 2014 93 5.6 4881 NaN 22.0
2552 Nine Lives Comedy A stuffy businessman finds himself trapped ins… Barry Sonnenfeld Kevin Spacey, Jennifer Garner, Robbie Amell,Ch… 2016 87 5.3 12435 19.64 11.0
2553 Nine Lives Family A stuffy businessman finds himself trapped ins… Barry Sonnenfeld Kevin Spacey, Jennifer Garner, Robbie Amell,Ch… 2016 87 5.3 12435 19.64 11.0
2554 Nine Lives Fantasy A stuffy businessman finds himself trapped ins… Barry Sonnenfeld Kevin Spacey, Jennifer Garner, Robbie Amell,Ch… 2016 87 5.3 12435 19.64 11.0

2555 rows × 11 columns

movies_genre_df.groupby("genre")["rating"].mean().sort_values(ascending=False)
genre
War          7.353846
Animation    7.324490
Biography    7.290123
History      7.127586
Music        7.075000
Sport        7.011111
Drama        6.953801
Musical      6.940000
Mystery      6.886792
Crime        6.786667
Adventure    6.772201
Western      6.771429
Sci-Fi       6.716667
Romance      6.685816
Family       6.684314
Comedy       6.647670
Action       6.614521
Thriller     6.593333
Fantasy      6.548515
Horror       6.089916
Name: rating, dtype: float64
movies_genre_df.groupby("genre")["rating"].count().sort_values(ascending=False)
genre
Drama        513
Action       303
Comedy       279
Adventure    259
Thriller     195
Crime        150
Romance      141
Sci-Fi       120
Horror       119
Mystery      106
Fantasy      101
Biography     81
Family        51
Animation     49
History       29
Sport         18
Music         16
War           13
Western        7
Musical        5
Name: rating, dtype: int64

Grouping by actor

In the following code a new dataframe is created containing one actor per row. Before the individual actor names are added to the dataframe any leading spaces at the beginning of the line are removed using the lstrip function.

data={}
for c in movies_df.columns:
    data=[]
for i in range(0, movies_df.shape[0]):
    actor_list=movies_df.iloc[i]['actors'].split(',')
    
    for a in actor_list:
        data["actors"].append(a.lstrip())
        for c in movies_df.columns:
            if c != "actors":
                data.append(movies_df.iloc[i])
movies_actor_df = pd.DataFrame(data)
movies_actor_df
title genre description director actors year runtime (minutes) rating votes revenue (millions) metascore
0 Guardians of the Galaxy Action,Adventure,Sci-Fi A group of intergalactic criminals are forced … James Gunn Chris Pratt 2014 121 8.1 757074 333.13 76.0
1 Guardians of the Galaxy Action,Adventure,Sci-Fi A group of intergalactic criminals are forced … James Gunn Vin Diesel 2014 121 8.1 757074 333.13 76.0
2 Guardians of the Galaxy Action,Adventure,Sci-Fi A group of intergalactic criminals are forced … James Gunn Bradley Cooper 2014 121 8.1 757074 333.13 76.0
3 Guardians of the Galaxy Action,Adventure,Sci-Fi A group of intergalactic criminals are forced … James Gunn Zoe Saldana 2014 121 8.1 757074 333.13 76.0
4 Prometheus Adventure,Mystery,Sci-Fi Following clues to the origin of mankind, a te… Ridley Scott Noomi Rapace 2012 124 7.0 485820 126.46 65.0
3994 Search Party Adventure,Comedy A pair of friends embark on a mission to reuni… Scot Armstrong Shannon Woodward 2014 93 5.6 4881 NaN 22.0
3995 Nine Lives Comedy,Family,Fantasy A stuffy businessman finds himself trapped ins… Barry Sonnenfeld Kevin Spacey 2016 87 5.3 12435 19.64 11.0
3996 Nine Lives Comedy,Family,Fantasy A stuffy businessman finds himself trapped ins… Barry Sonnenfeld Jennifer Garner 2016 87 5.3 12435 19.64 11.0
3997 Nine Lives Comedy,Family,Fantasy A stuffy businessman finds himself trapped ins… Barry Sonnenfeld Robbie Amell 2016 87 5.3 12435 19.64 11.0
3998 Nine Lives Comedy,Family,Fantasy A stuffy businessman finds himself trapped ins… Barry Sonnenfeld Cheryl Hines 2016 87 5.3 12435 19.64 11.0

3999 rows × 11 columns

Sorting by number of movie appearances

The count method is used to determine how many movies each actor has appeared in. The list is sorted from highest to lowest.

movies_actor_df.groupby("actors")["title"].count().sort_values(ascending=False)
actors
Mark Wahlberg         15
Hugh Jackman          14
Brad Pitt             13
Christian Bale        13
Scarlett Johansson    12
                      ..
Jackie Earle Haley     1
Jackie Chan            1
Jacki Weaver           1
Jack Taylor            1
Óscar Jaenada          1
Name: title, Length: 1985, dtype: int64

Ranking actors

Next we rank actors based on the average metascore of all movies they have appeared in.

In this case the list is skewed by actors who have only appeared in a single movie.

grouped_by_actors =movies_actor_df.groupby("actors")
grouped_by_actors["metascore"].mean().sort_values(ascending=False)
actors
Ellar Coltrane       100.0
Elijah Smith         100.0
Patricia Arquette    100.0
Shariff Earp          99.0
Mahershala Ali        99.0
                     ...  
Tom Hughes             NaN
Val Kilmer             NaN
Vanessa Ferlito        NaN
Zoë Bell               NaN
Émilie Leclerc         NaN
Name: metascore, Length: 1985, dtype: float64

Adding a minimum number of movies filter

To ensure that the ranking of actors is not skewed by those who have only appeared in a small number of movies, we filter the data to only include actors who have appeared in more than 6 movies.

The high flyers
filtered_grouped_by_actors= grouped_by_actors.filter(lambda x: x['rating'].count() > 6).groupby("actors")
filtered_grouped_by_actors["metascore"].mean().sort_values(ascending=False).head(10)
actors
Jeremy Renner           75.625000
George Clooney          73.142857
Amy Adams               72.625000
Brad Pitt               72.076923
Joel Edgerton           71.625000
Rooney Mara             70.428571
Ryan Gosling            70.400000
Joseph Gordon-Levitt    70.250000
Matt Damon              70.250000
Jonah Hill              70.111111
Name: metascore, dtype: float64
The stinkers
filtered_grouped_by_actors["metascore"].mean().sort_values(ascending=True).head(10)
actors
Adam Sandler        30.888889
Jennifer Aniston    40.625000
Ryan Reynolds       44.714286
Zac Efron           45.500000
Will Smith          47.111111
Teresa Palmer       47.333333
Liam Neeson         47.600000
Jason Sudeikis      48.833333
Gerard Butler       49.600000
Robert De Niro      50.125000
Name: metascore, dtype: float64